The California Water Boards' Annual Performance Report - Fiscal Year 2016-17
REGULATE: WATER QUALITY CERTIFICATION PROGRAM
GROUP:
401 Water Quality Certifications
MEASURE
3, 4
:
AVERAGE NUMBER OF DAYS BETWEEN RECEIPT OF AN IDNIVIDUAL 401 APPLICATION AND INITIAL REGULATORY ACTION ON THAT APPLICATION
AVERAGE NUMBER OF DAYS BETWEEN RECEIPT OF ALL SUPPLEMENTAL INFORMATION AND INDIVUDUAL 401 CERTIFICATION, OR DENIAL
MESSAGE:
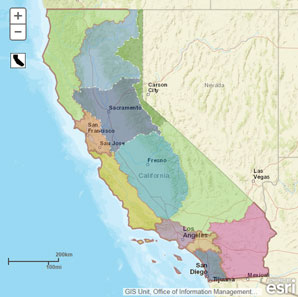
The Water Quality Certification program regulated 5,153 active projects and received new 1,380 water quality certification applications during the fiscal year.
Key Statistics for FY 2015-16
Projects regulated statewide
5,072
Applications received statewide
1,310
MEASUREMENTS
- Data Last Updated on:
04-23-2018 (12:46 pm)
Region
Acres
Active Projects
Applications Received
1
12,443,367
639
150
2
2,892,908
1,056
268
3
7,355,824
392
91
4
2,848,718
351
61
5
37,980,338
1,334
307
6
20,986,959
300
81
7
12,712,384
105
17
8
1,791,532
461
129
9
2,484,354
394
178
SB
0
40
28
Statewide
101,496,384
5,072
1,310
WHAT THE MEASURE IS SHOWING
Statewide, staff regulated 5,153 active projects during the fiscal year and there were 1,380 new applications received. Staff review application information and consult with the applicant and other agencies to ensure project impacts are avoided and minimized to the greatest extent possible and to approve appropriate compensatory mitigation for unavoidable impacts.
WHY THIS MEASURE IS IMPORTANT
Dredge and fill projects are regulated from the start of project construction through the period of any required on-site monitoring to ensure permit compliance. Work associated with managing active projects includes (but is not limited to): approving mitigation plans, reviewing monitoring reports, conducting site inspections and potential enforcement actions. In addition to managing active projects, staff review certification applications. Each certification application represents a project with potential impacts to waters of the state.
TECHNICAL CONSIDERATIONS
Data Source: CIWQS. Period July 1, 2016 to June 30, 2017.
Data Definitions:Measure 1: is the number of WQC Program regulatory measures active during any part of the fiscal year, regardless of the effective date of the certification. Measure 2: is the number of applications received during the fiscal year. Both measures 1 & 2 are for all permit types: individual 401, WDR, and general order enrollees.